# Import libraries
from dotenv import load_dotenv
import osCreating Custom branca Legends for folium Maps with HTML and CSS
(D) Data Visualization
geospatial data
HTML
CSS
library - pandas
library - base64
library - folium
library - branca
library - IPython.display
No map is complete without a legend. Learn how to make a
branca legend to match the circle markers in your folium maps using HTML and CSS. Stylize the legend boxes, add legend titles and make legend entries with circle, square and rectangle markers. Complete code is available in the GitHub repository.
folium maps with circle markers using HTML, CSS and the branca library.1 Introduction
No map is complete without a legend. Perhaps you have created your own interactive folium map, or you’re coming from my previous tutorial on how to draw scatter plot like circle markers on folium maps. Either which way, you are in need of a legend.
This blog post shows you how to create a legend in folium using the branca library. We will cover legends for maps with circle markers, generated with the folium.CircleMarker() object, but the code can be modified to create square or rectangles instead of circles.
1.1 What You’ll Learn in This Tutorial
By the end of this tutorial, you’ll learn how to:
- Make a legend box with HTML using the
brancalibrary - Include a legend title
- Insert circle markers as legend entries and be able to modify the marker’s
- size
- stroke and fill color
- opacity
- Split the
<style>attributes into inline and internal CSS and create local functions to incorporate user defined input into the inline CSS
If you prefer to skip the explanations and jump straight to the implementation, you can download the code from my GitHub repository.
Here is the list of things you’ll need to run the code.
1.2 Prerequisites
- A copy of either the
folium-map-legend.ipynbJupyter notebook orfolium-map-legend.pyPython script from my GitHub repository data/subfolder- Python libraries
pandasfoliumbrancabase64IPython.display
1.3 Jargon
CSS: Stands for Cascading Style Sheets. It refers to code snippets that designate the visuals and designs of elements.
Inline CSS: A method of styling HTML elements by writing the CSS properties and its corresponding values directly inside the appropriate HTML tag.
Internal CSS: A method of styling HTML elements by including CSS properties under the <style> element inside the HTML <head> section. The CSS and HTML code snippets live in separate sections, but within the same file.
HTML: Stands for Hypertext Markup Language. It is the standard code to structure and display elements on a website. Elements are encased in tags in the form of <tag>element</tag>, which can have further attributes and properties.
WarningWarning: When running this notebook locally, the generated maps will look different
I have used CARTO’s free tier to access Positron map tiles to generate the maps in this tutorial. For obvious security reasons, the personal API key I used to access the map tiles is saved in a separate, invisible .env file.
If you’d like to generate the exact maps generated in this tutorial, you will need to grab your own free API key from CARTO, and overwrite the carto_api_key variable with your own API key.
If you decide to run the code without an API key, the program has been set to work with OpenStreetMap as the basemap. As such, the generated map will look a bit different from the original tutorial.
# Import .env file containing the API key for CARTO ('carto_API_key')
if load_dotenv():
# CARTO API key (request one free at https://carto.com/basemaps/apikey)
carto_api_key = os.getenv('carto_API_key')
# Construct the tile URL template with the API key parameter
tile_url = f"https://basemaps.cartocdn.com/rastertiles/light_all/{{z}}/{{x}}/{{y}}.png?key={carto_api_key}"
# Manual attrition needed
attr = '© <a href="https://www.openstreetmap.org/copyright">OpenStreetMap</a> contributors © <a href="https://carto.com/attributions">CARTO</a>'
else:
# If no .env file, use open street map
tile_url = 'https://tile.openstreetmap.org/{z}/{x}/{y}.png'
# Attrition
attr = '© <a href="https://www.openstreetmap.org/copyright">OpenStreetMap</a> contributors'2 Rendering folium Maps in Your IDE
If you are coming from my previous blog post on drawing circle markers on folium maps, you are familiar with the rendering issue encountered with folium maps in VS Code (Figure 1).

folium and VS Code resulting in the maps not rendering in the Jupyter Notebook.
The solution that I recommended was to make a function that embeds the folium map into an IFrame, and call the function within the Jupyter notebook.
We’ll need the base64 and IPython.display libraries for the function to run smoothly.
# Libraries needed to embed the folium map into an IFrame using base64 encoding
import base64
from IPython.display import IFrame, displayPlease note that this function is straight from the GitHub discussions.
def show_folium_safe(m, height=500):
"""
Displays a Folium map in a safe IFrame using Base64 encoding.
This avoids "Trusted" errors, file path issues, and CSS leakage.
Source: https://github.com/microsoft/vscode-jupyter/issues/17224#issuecomment-3679624559
"""
# 1. Get the raw HTML string of the map
html_content = m.get_root().render()
# 2. Encode the HTML to base64
# This allows us to put the entire map "inside" the URL string
encoded = base64.b64encode(html_content.encode('utf-8')).decode('utf-8')
# 3. Create a Data URI
data_uri = f"data:text/html;charset=utf-8;base64,{encoded}"
# 4. Display the IFrame
# We use width='100%' to fill the cell width, but the CSS is trapped inside
display(IFrame(src=data_uri, width="100%", height=height))So now, instead of calling m to display the map, we can call show_folium_safe(m) instead.
With that out of the way, let’s quickly make a map to draw our legend upon.
3 Setting Up a folium Map
We’ll use the map of the weather stations in the Sendai region in Japan from a previous blog post as a starting point. We’ll briefly go over the steps of downloading the data, making a folium map, drawing the circle markers for each weather station, and adding hover over and pop up text.
First, download the CSV file containing the preprocessed weather station data of Japan as a pandas DataFrame, and get rid of the columns and rows that we won’t be using. Specifically, the Sendai prefecture weather stations have a prec_no between 31 and 36:
# Import the pandas library
import pandas as pd# Read the CSV file containing all information
fileName = './data/amedas_stations_all.csv'
amedas_df_all = pd.read_csv(fileName, encoding='utf-8')
# Getting rid of the columns we won't be using
amedas_df = amedas_df_all.drop(["prefectural_bureau",
"station_id",
"katakana_name",
"location",
"observation_start_date",
"weather_info_name",
"notes1",
"notes2"], axis=1)
# Using only the rows in the Sendai region
boolMask = (amedas_df['prec_no'] >= 31) & (amedas_df['prec_no'] <= 36)
sendai_df = amedas_df[boolMask].reset_index(drop=True)
# Take a peek at the resulting DataFrame
sendai_df.head()| prec_no | block_no | station_type | url_station_type | station_name | romaji_name | latitude_decimal | longitude_decimal | elevation | observation_start_date_rain | observation_start_date_other | anemometer_height | thermometer_height | rainfall_YN | temperature_YN | wind_YN | sunshine_YN | relative_humidity_YN | atmospheric_pressure_YN | snowfall_YN | |
|---|---|---|---|---|---|---|---|---|---|---|---|---|---|---|---|---|---|---|---|---|
| 0 | 31 | 1041 | 四 | a | 大間 | ooma | 41.526667 | 140.911667 | 14 | 1975-05-24 | 1976-11-24 | 9.9 | 2 | Y | Y | Y | Y | Y | N | Y |
| 1 | 31 | 1559 | 雨 | a | 湯野川 | yunokawa | 41.313333 | 140.956667 | 162 | 2005-10-21 | 2005-10-21 | - | - | Y | N | N | N | N | N | N |
| 2 | 31 | 47576 | 官 | s | むつ | mutsu | 41.283333 | 141.210000 | 3 | 1974-11-01 | 1975-12-10 | 11.1 | 1.5 | Y | Y | Y | Y | Y | Y | Y |
| 3 | 31 | 1122 | 四 | a | 小田野沢 | odanosawa | 41.235000 | 141.396667 | 6 | 1976-11-22 | 1976-11-22 | 9.9 | 2 | Y | Y | Y | Y | Y | N | N |
| 4 | 31 | 1026 | 四 | a | 今別 | imabetsu | 41.180000 | 140.481667 | 30 | 1975-05-21 | 1976-11-16 | 9.9 | 2 | Y | Y | Y | Y | Y | N | Y |
We can calculate the middle or the mean of the station coordinates using the .mean() method on the appropriate columns. This will act as the center point for our folium maps.
# Find the middle of the map
mid_lat = sendai_df['latitude_decimal'].mean()
mid_long = sendai_df['longitude_decimal'].mean()To make the actual map, import the folium library:
# Import folium library
import foliumThen, we will call MapSendaiJurisdiction_popup(), a local function from our previous blog post, which returns a folium.Map() object containing:
- All the weather stations in the Sendai region marked with circles
- Varying marker sizes, colors and opacities depending on the type of weather data collected at the station
- Hover over and pop up text for each circle marker
def MapSendaiJurisdiction_popup(sendai_df, mid_lat, mid_long, tile_url, attr):
"""Function to generate the folium map (m) for the Sendai jurisdiction with popups
AUTHOR: Mai Tanaka (www.DataDrivenMai.com)
DATE: 2026-08-24
REQUIRES: sendai_df = DataFrame containing weather station information from Sendai region
mid_lat = Latitude to center the map upon
mid_long = Longitude to center the map upon
tile_url = URL for accessing the basemap
attr = Attrition for the map data
PROMISES: m = folium map object of the Sendai jurisdiction, complete with popups
"""
# Generate a folium map
m = folium.Map(location=[mid_lat, mid_long],
tiles=tile_url,
zoom_start=6,
min_zoom=5,
attr=attr,
)
# Work through each row to plot a circle marker and generate popups
for rowNow in sendai_df.itertuples():
# Location of the weather station
lat_now = float(rowNow.latitude_decimal)
long_now = float(rowNow.longitude_decimal)
# Make the mouse over information
mouseover_info = f"<h5>{rowNow.romaji_name.capitalize()} ({rowNow.station_name})</h5>"
# Make the popup information
html_popup = GenerateHTML4Popup(rowNow)
# Adjust size of marker and fill opacity according to station type
if rowNow.station_type == '雨' or rowNow.station_type == '雪':
radius_now = 2
fill_opacity = 0.5
elif rowNow.station_type == '三':
radius_now = 2
fill_opacity = 0.2
elif rowNow.station_type == '四':
radius_now = 3
fill_opacity = 0.4
elif rowNow.station_type == '官':
radius_now = 5
fill_opacity = 0.8
# Adjust marker fill and stroke colors
color_sendai = '#F78C6B'
if rowNow.snowfall_YN == 'Y':
stroke_color = '#495057'
if rowNow.station_type == '雪':
fill_color = 'white'
else:
fill_color = color_sendai
elif rowNow.station_type == '雨':
fill_color = '#90E0EF'
stroke_color = '#90E0EF'
else:
fill_color = color_sendai
stroke_color = color_sendai
# Make the marker and add it to the folium map
markerNow = folium.CircleMarker(
location=[lat_now, long_now],
tooltip=mouseover_info,
popup=folium.Popup( # Insert pop up text
html=html_popup,
max_width=300,
max_height=150),
radius=radius_now,
weight=2,
color=stroke_color,
opacity=1.0,
fill_color=fill_color,
fill_opacity=fill_opacity,
).add_to(m)
# Return the map
return mNote that the local function MapSendaiJurisdiction_popup() calls another local function, GenerateHTML4Popup(), which we also copy from our previous tutorial:
def GenerateHTML4Popup(arg_df_row):
"""Function to generate the HTML to insert into a popup in folium
AUTHOR: Mai Tanaka (www.DataDrivenMai.com)
DATE: 2026-06-30
REQUIRES: arg_df_row = pandas dataframe row as .itertuples()
PROMISES: html_popup = html format to pass onto folium html input in popups
"""
# Determine the color of the Y/N fonts for the data collected
data_YN = [arg_df_row.rainfall_YN,
arg_df_row.temperature_YN,
arg_df_row.wind_YN,
arg_df_row.sunshine_YN,
arg_df_row.relative_humidity_YN,
arg_df_row.atmospheric_pressure_YN,
arg_df_row.snowfall_YN]
color_YN = []
for data_YN_now in data_YN:
if data_YN_now == 'Y':
color_YN.append('green')
else:
color_YN.append('red')
# Make the html_popup (contains a table of meteorological data collected)
html_popup = f"""
<h3> {arg_df_row.romaji_name.capitalize()}({arg_df_row.station_name})</h3>
prec_no: {arg_df_row.prec_no}
<br>
block_no: {arg_df_row.block_no}
<br>
a or s: {arg_df_row.url_station_type}
<br>
Location: {arg_df_row.latitude_decimal:.2f}°, {arg_df_row.longitude_decimal:.2f}°
<br>
Elevation: {arg_df_row.elevation} m
<br>
<br>
<h4>Data Collected</h4>
<table border="1">
<tr>
<td>rainfall</td>
<td><span style="color: {color_YN[0]}; font-weight: bold;">{data_YN[0]}</span></td>
</tr>
<tr>
<td>temperature</td>
<td><span style="color: {color_YN[1]}; font-weight: bold;">{data_YN[1]}</span></td>
</tr>
<tr>
<td>wind direction/speed</td>
<td><span style="color: {color_YN[2]}; font-weight: bold;">{data_YN[2]}</span></td>
</tr>
<tr>
<td>sunshine</td>
<td><span style="color: {color_YN[3]}; font-weight: bold;">{data_YN[3]}</span></td>
</tr>
<tr>
<td>relative humidity</td>
<td><span style="color: {color_YN[4]}; font-weight: bold;">{data_YN[4]}</span></td>
</tr>
<tr>
<td>atmospheric pressure</td>
<td><span style="color: {color_YN[5]}; font-weight: bold;">{data_YN[5]}</span></td>
</tr>
<tr>
<td>snowfall</td>
<td><span style="color: {color_YN[6]}; font-weight: bold;">{data_YN[6]}</span></td>
</tr>
</table>
<br>
Thermometer height: {arg_df_row.thermometer_height} m
<br>
Anemometer height: {arg_df_row.anemometer_height} m
<br>
<br>
<h4>Observation Start Dates</h4>
Rain: {arg_df_row.observation_start_date_rain}
<br>
Other: {arg_df_row.observation_start_date_other}
"""
return html_popupWe can now create and display a folium map with two lines of code:
# Create a map and display it
m = MapSendaiJurisdiction_popup(sendai_df, mid_lat, mid_long, tile_url, attr)
show_folium_safe(m)MapSendaiJurisdiction_popup() creates a map of the Sendai region with markers plotting the Japan Meteorological Agency (JMA) stations.
You can find the detailed explanation of the steps and code used to draw this map in my previous blog post. For the current tutorial, our focus is on making a custom legend, so we’ll just use the MapSendaiJurisdiction_popup() function.
With the map drawn, we can finally move onto drawing a legend.
4 Creating a Custom Legend
Making a legend in folium can be a bit tricky, as there is no built-in method to automatically generate a legend from the items drawn on the map. Even in the folium tutorial, legends were manually generated using HTML.
In this blog post, we will be creating a custom legend step-by-step using HTML and CSS.
Using the folium tutorial as a guide, we see that a legend HTML is created as a string, and is enclosed within {% macro html(this, kwargs) %}...{% endmacro %}:
legend_html = """
{% macro html(this, kwargs) %}
<div>
...HTML generating the legend...
</div>
{% endmacro %}
"""This legend_html string is fed into a branca.element.MacroElement() object to overwrite the inherited _template. The Python code to do the rewriting looks like this:
legend = branca.element.MacroElement()
legend._template = branca.element.Template(legend_html)The branca library is a helper library for folium to insert custom HTML elements. By overwriting the branca.element.MacroElement() object’s template with our custom HTML (and subsequently displaying this macroelement in the map), we create a map legend.
To add the branca.element.MacroElement() or legend to the folium.Map() object, we use the .add_child(legend) method:
m.get_root().add_child(legend)Let’s go ahead and import the branca library, so we can use the branca.element.MacroElement().
# Import the branca library
import brancaIn the following sections, we will incrementally add HTML to generate a custom legend, one component at a time. The legend we will be creating is specifically geared towards folium maps with scatter plot like circle markers, created with folium.CircleMarker(), but it can be easily adjusted to make squares or rectangles instead of circles.
Let us start with the most fundamental component: the legend box.
4.1 Legend Box
The first thing we’d like is a box to enclose our legend contents, effectively separating it from the rest of the map. Luckily, <div> HTML tags default to having a square or rectangle shape, which can easily act as our legend box. The rectangle can be modified using CSS properties by specifying a combination of width, height, top, right, left, bottom, border, and transform properties within the style HTML attribute.
Let us create a basic legend box with the following characteristics:
- Located at the bottom right corner of the map
- Has a width of 250 pixels and a height of 150 pixels
- White in color with 90 % opacity
The legend_html string contained within {% macro html(this, kwargs) %} ... {% endmacro %} looks something like this:
# Basic legend box
legend_html = """
{% macro html(this, kwargs) %}
<div
style='
position: fixed;
bottom: 20px;
right: 20px;
width: 250px;
height: 150px;
z-index: 9999;
background-color: rgba(255, 255, 255, 0.9);
'>
</div>
{% endmacro %}
"""In the code snippet above, the design of the legend box is determined according to the CSS properties and values, which are all a part of the HTML style attribute. The CSS properties are all included within the opening <div> tag, before the closing brackets.
Let’s clarify the CSS properties that we’ve set for the legend box:
position: fixed;keeps the legend box at the same location on the display (bottom right in this case), regardless of which part of the map we zoom intobottom: 20px;andright: 20px;places the legend at the bottom right corner, 20 pixels from the edges- If you wanted a legend at the top left corner, 50 pixels from the edges, you would use
top: 50px;andleft: 50px;
- If you wanted a legend at the top left corner, 50 pixels from the edges, you would use
width: 250px;andheight: 150px;assign a size to the legend box- You can also designate
height: auto;to allow the legend box to adjust its height, according to the content volume
- You can also designate
z-index: 9999;ensures that the legend is displayed as the top-most layer on thefoliummapbackground-color: rgba(255, 255, 255, 0.9);is assigning a white color at 90 % opacity as the legend box color
Let’s go ahead and draw this basic white legend box on the map of the Sendai region:
# Create the map with the complete pop up text
m = MapSendaiJurisdiction_popup(sendai_df, mid_lat, mid_long, tile_url, attr)
# Create a branca macroelement object
legend = branca.element.MacroElement()
# Over-write the macroelement template with the HTML for our legend
legend._template = branca.element.Template(legend_html)
# Add the legend to the map
m.get_root().add_child(legend)
# Display the map with the legend
show_folium_safe(m)Simple and effective.
But for those looking for a more sophisticated design, here are a couple additional CSS properties you can use for a legend box:
border-radius: 10px;rounds the corners of the legend boxbox-shadow: 0 0 15px rgba(0, 0, 0, 0.2);adds a black shadow of 20 % opacity, with no horizontal or vertical offset, but with 15 pixel blur- It’s a nice effect that makes the legend box “float” on the map
border: 2px dashed rgba(245, 39, 234, 0.8);gives a magenta-colored dashed border to the legend- A
solidline in grey is often a bit more subtle while improving legend visibility
- A
Here’s the updated legend HTML:
# Creating a slightly different legend box
legend_html = """
{% macro html(this, kwargs) %}
<div
style='
position: fixed;
bottom: 20px;
right: 20px;
width: 250px;
height: 150px;
z-index: 9999;
background-color: rgba(255, 255, 255, 0.9);
border-radius: 10px;
box-shadow: 0 0 15px rgba(0, 0, 0, 0.2);
border: 2px dashed rgba(245, 39, 234, 0.8);
font-family: Arial, sans-serif;
font-size: 14px;
padding: 10px;
'>
</div>
{% endmacro %}
"""I’ve also included some CSS properties that won’t be visible until some text has been added to the legend. Namely,
font-family: Arial, sans-serif;andfont-size: 14px;specifies the font style and size to be used within the legendpadding: 10px;adjusts the margin space between the border of the legend box and where the content of the legend sits
Let’s see how this updated legend box looks like on an actual map:
# Create the map with the complete pop up text
m = MapSendaiJurisdiction_popup(sendai_df, mid_lat, mid_long, tile_url, attr)
# Create a branca macroelement object
legend = branca.element.MacroElement()
# Over-write the macroelement template with the HTML for our legend
legend._template = branca.element.Template(legend_html)
# Add the legend to the map
m.get_root().add_child(legend)
# Display the map with the legend
show_folium_safe(m)You’ll want to decide which design elements you want to keep and which ones you won’t be needing. Generally, the simpler your code is, the lower your chances are of introducing unwanted typos and bugs.
Let’s take a deeper look into the HTML and CSS code that structures and stylizes the legend box.
4.1.1 Inline CSS and Internal CSS
In the code above, the <div>...</div> HTML tags created a legend box, while the various CSS properties under the style HTML attribute were responsible for styling the legend box. Since the CSS code was included within the <div> tag, it is considered to be inline CSS.
Inline CSS requires direct assignment of CSS properties and values within HTML tags. It is assigned to one object, and must be rewritten every time we want to apply its style to a particular object. In cases where we have multiple similar looking objects, inline CSS can result in lengthy and redundant code.
Let us pretend that we want to draw multiple legends on the same map. All the legend boxes will have more or less the same style (such as box-shadow and border-radius) but will differ in size and placement.
If we were to write the HTML using inline CSS properties, it would look like this:
# HTML and CSS for two legend boxes
legend_html = """
{% macro html(this, kwargs) %}
<div
id='map-legend-1'
style='
position: fixed;
bottom: 20px;
right: 20px;
width: 250px;
height: 150px;
z-index: 9999;
background-color: rgba(255, 255, 255, 0.9);
border-radius: 10px;
box-shadow: 0 0 15px rgba(0, 0, 0, 0.2);
font-family: Arial, sans-serif;
font-size: 14px;
padding: 10px;
'>
</div>
<div
id='map-legend-2'
style='
position: fixed;
top: 50px;
left: 100px;
width: 150px;
height: 300px;
z-index: 9999;
background-color: rgba(255, 255, 255, 0.9);
border-radius: 10px;
box-shadow: 0 0 15px rgba(0, 0, 0, 0.2);
font-family: Arial, sans-serif;
font-size: 14px;
padding: 10px;
'>
</div>
{% endmacro %}
"""I’ve given the first legend box (in the lower right corner of the map) an id of map-legend-1 and the second legend box (in the top left corner) an id of map-legend-2. Note how many of the CSS properties under each legend are exactly the same.
Rendering these two legend boxes looks like this:
# Create the map with the complete pop up text
m = MapSendaiJurisdiction_popup(sendai_df, mid_lat, mid_long, tile_url, attr)
# Create a branca macroelement object
legend = branca.element.MacroElement()
# Over-write the macroelement template with the HTML for our legend
legend._template = branca.element.Template(legend_html)
# Add the legend to the map
m.get_root().add_child(legend)
# Display the map with the legend
show_folium_safe(m)While the inline CSS works as expected, there are several lines of code which look exactly the same in the HTML snippets of the two legend boxes. The code will look cleaner if we migrate the CSS properties common across the two legend boxes as an internal (rather than inline) CSS.
In other words, we can define a 'map-legend' class, and give it a set of fixed CSS properties and values under the <head> tag: using .map-legend {...common CSS properties and values...} format. By attributing the same class='map-legend' to both legend boxes, the internal CSS properties can be reflected in the design of the legend box, along with the inline CSS properties.
The split inline and internal CSS code may look something like this:
# Start and end macros to enclose all HTML and CSS
macro_start = '{% macro html(this, kwargs) %}'
macro_end = '{% endmacro %}'
# CSS properties common to both legend boxes as internal CSS enclosed in <style> tags
legend_css = """
<style type='text/css'>
.map-legend {
position: fixed;
z-index: 9999;
background-color: rgba(255, 255, 255, 0.9);
box-shadow: 0 0 15px rgba(0, 0, 0, 0.2);
border-radius: 10px;
padding: 10px;
font-family: Arial, sans-serif;
font-size: 14px;
}
</style>
"""
# HTML for two legend boxes
legend_html = """
<div
id='map-legend-1'
class='map-legend'
style='
bottom: 20px;
right: 20px;
width: 250px;
height: 150px;
'>
</div>
<div
id='map-legend-2'
class='map-legend'
style='
top: 50px;
left: 100px;
width: 150px;
height: 300px;
'>
</div>
"""
# Concatenate all the HTML and CSS
legend_html_all = macro_start + legend_css + legend_html + macro_endThis creates a map with two legends, identical to that generated with the inline CSS, but with cleaner code.
# Create the map with the complete pop up text
m = MapSendaiJurisdiction_popup(sendai_df, mid_lat, mid_long, tile_url, attr)
# Create a branca macroelement object
legend = branca.element.MacroElement()
# Over-write the macroelement template with the HTML for our legend
legend._template = branca.element.Template(legend_html_all)
# Add the legend to the map
m.get_root().add_child(legend)
# Display the map with the legend
show_folium_safe(m)You may notice that we did not completely eliminate the inline CSS. CSS properties associated with the legend location (top, bottom, right and left), and the box size (width and height), remained as inline CSS properties to reflect the different values required for the two legend boxes. All other properties migrated to the internal CSS.
Now that the HTML and CSS code have been appropriately split, let’s see how we can include user-defined inputs.
4.1.2 User-Defined Inputs for Designating CSS Values
While the internal CSS was able to simplify the code by separating the common and variable properties, in the current HTML, the size and position of the legends are somewhat fixed. If we wanted to change the legend position or size in a separate map, we’d have to make a whole separate set of HTML for the legend, even if the general “look” of the legend boxes were to stay the same.
This nuisance can be solved by creating a local function which adjusts the HTML according to user-defined inputs, using formatted literals.
Let’s group the CSS properties and values associated with a particular legend box (including its id) within a Python dictionary. We’ll make a 200 pixel by 200 pixel square legend in the lower right corner of the map.
# Legend box id and its corresponding CSS properties and values
legend_box_1_dict = {'id': 'map-legend-1',
'bottom': '20px',
'right': '20px',
'box_width': '200px',
'box_height': '200px'}We can create a local function, GenerateLegendHTML_boxes() to generate the HTML for this legend box:
def GenerateLegendHTML_boxes(dict_legend):
"""Function to generate the HTML for stylized legend boxes
AUTHOR: Mai Tanaka (www.DataDrivenMai.com)
REQUIRES: dict_legend = dictionary containing legend id and CSS properties and values
PROMISES: legend_html = string containing HTML and inline CSS for generating stylized legend box
"""
# Check the position of the legend key
if 'bottom' in dict_legend:
bottom_pos = dict_legend['bottom']
top_pos = 'auto'
elif 'top' in dict_legend:
top_pos = dict_legend['top']
bottom_pos = 'auto'
if 'left' in dict_legend:
left_pos = dict_legend['left']
right_pos = 'auto'
elif 'right' in dict_legend:
right_pos = dict_legend['right']
left_pos = 'auto'
# Add on the new legend HTML legend to the exsiting HTML
legend_html = f"""
<div id={dict_legend['id']}
class='map-legend'
style='
position: fixed;
bottom: {bottom_pos};
top: {top_pos};
right: {right_pos};
left: {left_pos};
width: {dict_legend['box_width']};
height: {dict_legend['box_height']}
'>
</div>
"""
return legend_htmlUser-defined inputs are incorporated into the legend HTML using formatted literals. Take a look at the first couple lines:
legend_html = f"""
<div id={dict_legend['id']}
...
</div>
"""The f preceding the quotation marks signify the definition of a formatted literal, or a f-string. Formatted literals can take in variables using the convention: {variable_name}. In the example above, we are using values defined in the Python dictionary as values for the CSS properties.
Note that each legend box generated in the local function uses the map-legend class from before. In other words, it inherits the internal CSS properties associated with this class, which we’ve defined outside the local function.
Additionally, the if-else statements within GenerateLegendHTML_boxes() function allows the function to work with just two position assignments: top or bottom, and left or right position. The remaining position CSS properties default to auto.
Let’s go ahead and creat the HTML for the legend box with the parameters in the dictionary using GenerateLegendHTML_boxes(). Just remember to concatenate it with the internal CSS snippets and enclose it within the starting and ending macros:
# Create legend_html using the legend_box_1_dict
legend_html = GenerateLegendHTML_boxes(legend_box_1_dict)
# Concatenate all the HTML and CSS
legend_html_all = macro_start + legend_css + legend_html + macro_endIndeed, we get a square legend box in the lower right corner with this newly generated legend HTML.
# Create the map with the complete pop up text
m = MapSendaiJurisdiction_popup(sendai_df, mid_lat, mid_long, tile_url, attr)
# Create a branca macroelement object
legend = branca.element.MacroElement()
# Over-write the macroelement template with the HTML for our legend
legend._template = branca.element.Template(legend_html_all)
# Add the legend to the map
m.get_root().add_child(legend)
# Display the map with the legend
show_folium_safe(m)GenerateLegendHTML_boxes(), with CSS properties and values stored in a dictionary.
To create multiple legend boxes within the same map, we’ll need a list of Python dictionaries, each containing the CSS properties and values specifying the legend box position and size:
# Legend box id and its corresponding CSS properties and values
legend_box_1_dict = {'id': 'map-legend-1',
'bottom': '20px',
'right': '20px',
'box_width': '200px',
'box_height': '200px'}
legend_box_2_dict = {'id': 'map-legend-2',
'top': '70px',
'left': '50px',
'box_width': '300px',
'box_height': '150px'}
legend_box_3_dict = {'id': 'map-legend-3',
'top': '30px',
'right': '10px',
'box_width': '100px',
'box_height': '150px'}
# The final list of dictionaries
legend_box_dict = [legend_box_1_dict, legend_box_2_dict, legend_box_3_dict]Since the HTML for all legend boxes need to be included in the legend_html string, we’ll need to loop through the list, and concatenate the string for all legend boxes together.
# Create legend_html using the legend_box_dict by looping
legend_html = ''
for legend_dict in legend_box_dict:
legend_html += GenerateLegendHTML_boxes(legend_dict)
# Concatenate all the HTML and CSS
legend_html_all = macro_start + legend_css + legend_html + macro_endAs with the examples before, don’t forget to add the legend_css snippet and enclose legend_html with the macros.
Let’s see if we can see the three legend boxes in the map:
# Create the map with the complete pop up text
m = MapSendaiJurisdiction_popup(sendai_df, mid_lat, mid_long, tile_url, attr)
# Create a branca macroelement object
legend = branca.element.MacroElement()
# Over-write the macroelement template with the HTML for our legend
legend._template = branca.element.Template(legend_html_all)
# Add the legend to the map
m.get_root().add_child(legend)
# Display the map with the legend
show_folium_safe(m)GenerateLegendHTML_boxes(), with CSS properties and values stored in a list of dictionaries.
Voila!
Not only have we made the HTML to make a stylized legend box, we’ve been able to group and split out the CSS properties common among elements as internal CSS (instead of keeping it as inline CSS) and made a local function that is capable of taking in user-specified values for the legend box position and size.
In the following section, we’ll revert back to having just one legend in the lower right corner, and start populating it with content.
4.2 Legend Title
Let’s place a legend title in our legend box. We can include 'title': 'Types of Data Collected' as a new entry in the Python dictionary from before:
# Python dictionary with the user-defined inputs, including the legend title
legend_box_1_dict = {'id': 'map-legend-1',
'title': 'Types of Data Collected',
'bottom': '20px',
'right': '20px',
'box_width': '250px',
'box_height': 'auto'}You may have noticed that I made the legend box height to auto, which allows the box size to automatically adjust to the amount of content.
In terms of CSS properties, let’s say we’d like the legend title to always:
- Be written in bold text (
font-weight: bold) - Have a bit of space below (
margin-bottomin pixels)
Since these are common to any legend title, let’s include these as internal CSS. Rewrite the legend_css to include a new class of .legend-title and list the CSS properties associated with the legend title:
# CSS properties to include as internal CSS enclosed in <style> tags
legend_css = """
<style type='text/css'>
.map-legend {
position: fixed;
z-index: 9999;
background-color: rgba(255, 255, 255, 0.9);
box-shadow: 0 0 15px rgba(0, 0, 0, 0.2);
border-radius: 10px;
padding: 10px;
font-family: Arial, sans-serif;
font-size: 14px;
}
.legend-title {
font-weight: bold;
margin-bottom: 8px;
}
</style>
"""By designating an HTML element with class=legend-title we can inherit the CSS properties of having bold font with a margin below it.
To include the legend title into the legend box, we use <div class=legend-title>...</div> tags for the title, and nest it within the <div>...legend box...</div> tags associated with the legend box. Simply put, we want to place a new box for the legend title within the legend box.
Let’s modify the GenerateLegendHTML_boxes() function to include a legend title with the appropriate designation, and rename it as GenerateLegendHTML_title():
def GenerateLegendHTML_title(dict_legend):
"""Function to generate the HTML for stylized legend boxes with a legend title
AUTHOR: Mai Tanaka (www.DataDrivenMai.com)
REQUIRES: dict_legend = dictionary containing legend id and CSS properties and values
PROMISES: legend_html = string containing HTML and inline CSS for generating stylized legend box
"""
# Check the position of the legend key
if 'bottom' in dict_legend:
bottom_pos = dict_legend['bottom']
top_pos = 'auto'
elif 'top' in dict_legend:
top_pos = dict_legend['top']
bottom_pos = 'auto'
if 'left' in dict_legend:
left_pos = dict_legend['left']
right_pos = 'auto'
elif 'right' in dict_legend:
right_pos = dict_legend['right']
left_pos = 'auto'
# Add on the new legend HTML legend to the existing HTML
legend_html = f"""
<div id='{dict_legend['id']}'
class='map-legend'
style='
position: fixed;
bottom: {bottom_pos};
top: {top_pos};
right: {right_pos};
left: {left_pos};
width: {dict_legend['box_width']};
height: {dict_legend['box_height']}
'>
<div class='legend-title'>{dict_legend['title']}</div>
</div>
"""
return legend_htmlLet’s create this legend with a title and display it on the map:
# Create legend_html using the legend_box_1_dict and concatenate it all
legend_html = GenerateLegendHTML_title(legend_box_1_dict)
legend_html_all = macro_start + legend_css + legend_html + macro_end
# Create the map with the complete pop up text
m = MapSendaiJurisdiction_popup(sendai_df, mid_lat, mid_long, tile_url, attr)
# Create a branca macroelement object and overwrite it with our legend html
legend = branca.element.MacroElement()
legend._template = branca.element.Template(legend_html_all)
# Add the legend to the map
m.get_root().add_child(legend)
# Display the map with the legend
show_folium_safe(m)GenerateLegendHTML_title() local function. The legend-title class inherits the bold font with 8 pixels of margin space below it from the internal CSS.
The legend box looks considerably smaller due to the height set to auto, but it contains the legend title in bold. If you look closely, you’ll notice that the title has more space below the text compared to above it, indicating that margin-bottom is working as expected.
Now that we have the legend title in place, we’ll move onto the actual legend entries.
4.3 Legend Entries with Circle Markers
The legend entries as a whole can be created as an unordered list with the <ul>...all markers go here...</ul> tag. Each legend entry can be generated as a list item, using <li>...one marker...</li> tag. The style of the legend markers preceding the description can be designated using <span></span> tags inside the list item.
In terms of the placement of the legend entries, the unordered list will go below the legend title, and before the closing </div> tag for the legend box. In pseudocode form, this would look like:
legend_html = f"""
<div> ...Legend box opening tag
<div> ...Legend title goes here... </div>
<div> ...Legend entries section starts
<ul> ...Legend entries as unordered list
<li><span></span> ...Marker 1 design
...Marker 1 description goes here...
</li>
<li><span></span> ...Marker 2 design
...Marker 2 description goes here...
</li>
<li><span></span> ...Marker 3 design
...Marker 3 description goes here
</li>
</ul> ...Closing tag for unordered list
</div> ...Closing tag for legend entries
</div> ...Closing tag for legend box
"""In the following section, we’ll use real HTML and CSS code to insert actual legend entries with markers and descriptions into the map.
4.3.1 Marker Shapes, Colors and Borders
Let us momentarily use fixed marker properties and values. We’ll add flexibility in the marker designs and legend entry descriptions in the next section. We’ll make a local function, GenerateLegendHTML_marker(), to generate the HTML for a legend with three entries, formatted as shown in the pseudocode above, using the <ul> and <li> tags. For variety, we’ll includee a circle marker, a square marker and a rectangle marker.
def GenerateLegendHTML_marker(dict_legend):
"""Function to generate the HTML for stylized legend boxes with a legend title and preset legend entries
AUTHOR: Mai Tanaka (www.DataDrivenMai.com)
REQUIRES: dict_legend = dictionary containing legend id and CSS properties and values
PROMISES: legend_html = string containing HTML and inline CSS for generating stylized legend box
"""
# Check the position of the legend key
if 'bottom' in dict_legend:
bottom_pos = dict_legend['bottom']
top_pos = 'auto'
elif 'top' in dict_legend:
top_pos = dict_legend['top']
bottom_pos = 'auto'
if 'left' in dict_legend:
left_pos = dict_legend['left']
right_pos = 'auto'
elif 'right' in dict_legend:
right_pos = dict_legend['right']
left_pos = 'auto'
# Add on the new legend HTML legend to the exsiting HTML
legend_html = f"""
<div id='{dict_legend['id']}'
class='map-legend'
style='
position: fixed;
bottom: {bottom_pos};
top: {top_pos};
right: {right_pos};
left: {left_pos};
width: {dict_legend['box_width']};
height: {dict_legend['box_height']}
'>
<div class='legend-title'>{dict_legend['title']}</div>
<div>
<ul
style='
list-style-type: none;
margin-bottom: 5px;
'>
<li><span
style='
float: left;
margin-right: 8px;
margin-top: 3px;
border-radius: 50%;
height: 9px;
width: 9px;
background: rgba(245, 40, 145, 0.8);
border: 2px solid rgba(0, 0, 0, 0.2);
'></span>
Marker 1
</li>
<li><span
style='
float: left;
margin-right: 8px;
margin-top: 3px;
height: 12px;
width: 12px;
background: rgba(39, 245, 230, 0.8);
border: 2px dotted rgba(0, 0, 0, 0.2);
'></span>
Marker 2
</li>
<li><span
style='
float: left;
margin-right: 8px;
margin-top: 3px;
border-radius: 25%;
height: 15px;
width: 30px;
background: rgba(139, 245, 23, 0.8);
'></span>
Marker 3
</li>
</ul>
</div>
</div>
"""
return legend_htmlAs list elements inside the <ul> (unordered list) are preceded by bullet points, we need to specify the CSS property of list-style: none; under the style attribute to delete the bullet points. The style attributes under the <span> tags nested inside each <li> or list item tag specify the style used for each marker.
Let’s see how the markers look on a map and explain the CSS properties afterwards:
# Create legend_html using the legend_box_1_dict and concatenate it all
legend_html = GenerateLegendHTML_marker(legend_box_1_dict)
legend_html_all = macro_start + legend_css + legend_html + macro_end
# Create the map with the complete pop up text
m = MapSendaiJurisdiction_popup(sendai_df, mid_lat, mid_long, tile_url, attr)
# Create a branca macroelement object and overwrite it with our legend html
legend = branca.element.MacroElement()
legend._template = branca.element.Template(legend_html_all)
# Add the legend to the map
m.get_root().add_child(legend)
# Display the map with the legend
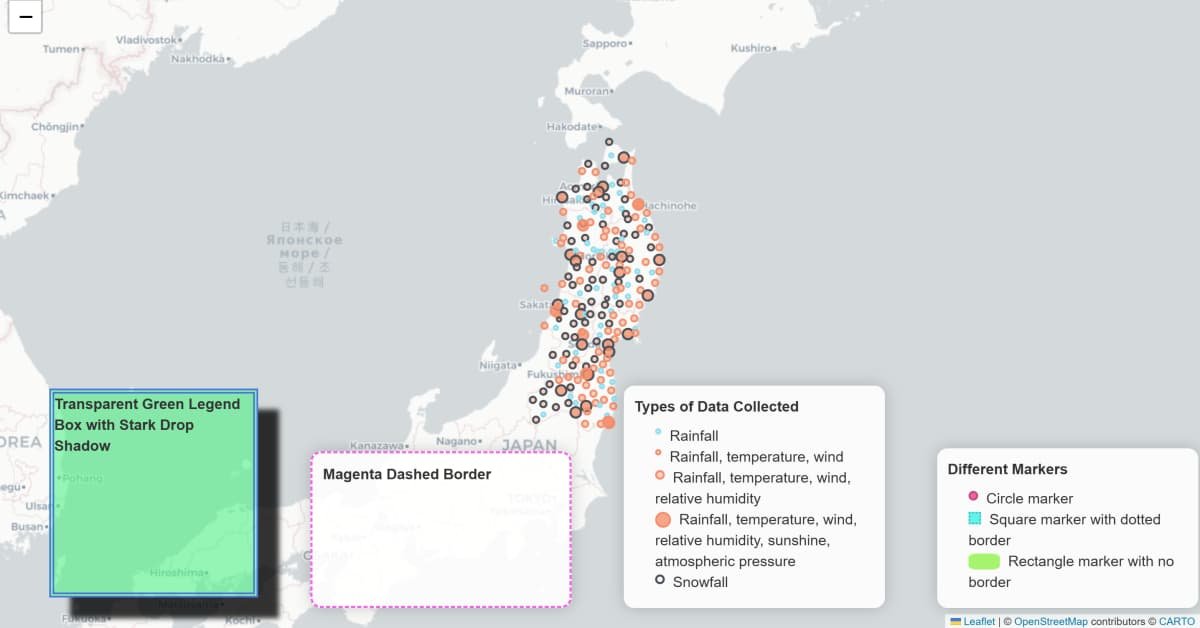
show_folium_safe(m)GenerateLegendHTML_marker(). A circle, square and rectangle marker are generated as list items within an unordered list.
We show three marker designs in Figure 10.
- Marker 1 is a 9 pixel by 9 pixel circle marker with solid stroke and fill color
- Marker 2 is a 12 pixel by 12 pixel square marker with a dotted stroke and solid fill color
- Marker 3 is a 15 pixel by 30 pixel rectangle marker with rounded corners and just a fill color
The differences in the marker appearances are due to slight differences in the inline CSS properties for each list item. Below, I’ll explain the CSS properties used:
float: left;ensures that each legend entry is pushed to the left side of the containermargin-right: 8px;andmargin-top: 3px;ensures some padding on the right and top side of the markerborder-radius:designates how much we should round the corners of the starting square shape0%or not designating aborder-radiuscreates a square or rectangle shape25%gives a square or rectangle with rounded corners50%generates a circle
- The size of the marker is specified in pixels with
height:andwidth:properties- For circles or squares, the height and width should be the same
background:designates the fill color of the marker- As with before,
rgba()refers to red, green, blue and alpha (or opacity)
- As with before,
border:specifies the stroke width (in pixels), the line style, and its color- For example,
border: 2px dotted rgba(0, 0, 0, 0.2);designates a black dotted border with 20 % opacity and 2 pixels in width
- For example,
We’ve created a legend with three different entries. However, GenerateLegendHTML_marker() creates the same three legend entries regardless of the content of the dictionary containing the user input. We’d like to incorporate user-defined inputs for the legend entry marker designs and their respective descriptions.
To do so, we need to separate the CSS properties to those common across legend entries, which will migrate to the internal CSS, and the properties which will vary between legend entries, which will remain as inline CSS.
4.3.2 Internal and Inline CSS for Circle Markers in the Legend Entry
As with the legend box, we’d like to separate the CSS properties into internal and inline CSS, depending of whether they are fixed or variable.
Here is a list of CSS properties that will remain fixed across all legend entries:
float: left;margin-right: 8px;andmargin-top: 3px;border-radius: 50%;(all legend entries will be circle markers)
Here are CSS properties that will change from entry to entry:
background:marker fill color and opacityborder:marker stroke color- stroke width and its pattern (solid) will remain the same
height:andwidth:which define the marker size
Let’s rewrite the legend_css internal CSS string to include a new legend-labels class to store the fixed CSS properties across all legend entries:
# CSS properties to include as internal CSS enclosed in <style> tags
legend_css = """
<style type='text/css'>
.map-legend {
position: fixed;
z-index: 9999;
background-color: rgba(255, 255, 255, 0.9);
box-shadow: 0 0 15px rgba(0, 0, 0, 0.2);
border-radius: 10px;
padding: 10px;
font-family: Arial, sans-serif;
font-size: 14px;
}
.legend-title {
font-weight: bold;
margin-bottom: 8px;
}
.legend-labels {
list-style-type: none;
margin-bottom: 5px;
}
.legend-labels li span {
float: left;
margin-right: 8px;
margin-top: 3px;
border-radius: 50%;
}
</style>
"""The style attributes of list-style-type: none; and margin-bottom: 5px;, associated with the unordered list in general, are assigned to the class .legend-labels. CSS properties and values that are associated with each marker or list item are assigned within the descendent selector of .legend-labels li span. In other words, the CSS properties of float: left;, margin-right: 8px;, margin-top: 3px; and border-radius: 50%; are assigned only to HTML objects enclosed inside <li><span> ... </span></li> tags, under the .legend-labels class.
The CSS properties that change between legend entries can be stored as a Python dictionary. We’ll prepare five markers that mimic the five types of circle markers shown in the actual map.
# Python dictionary with inline CSS properties for the markers
color_sendai = '#F78C6B'
marker_1_dict = {
'description': 'Rainfall',
'marker_fill': '#90E0EF',
'fill_opacity': 0.5,
'stroke_color': '#90E0EF',
'marker_height': '6px',
'marker_width': '6px',
}
marker_2_dict = {
'description': 'Rainfall, temperature, wind',
'marker_fill': color_sendai,
'fill_opacity': 0.2,
'stroke_color': color_sendai,
'marker_height': '6px',
'marker_width': '6px',
}
marker_3_dict = {
'description': 'Rainfall, temperature, wind, relative humidity',
'marker_fill': color_sendai,
'fill_opacity': 0.4,
'stroke_color': color_sendai,
'marker_height': '9px',
'marker_width': '9px',
}
marker_4_dict = {
'description': 'Rainfall, temperature, wind, relative humidity, sunshine, atmospheric pressure',
'marker_fill': color_sendai,
'fill_opacity': 0.8,
'stroke_color': color_sendai,
'marker_height': '15px',
'marker_width': '15px',
}
marker_5_dict = {
'description': 'Snowfall',
'marker_fill': '#FFFFFF',
'fill_opacity': 0.5,
'stroke_color': '#495057',
'marker_height': '9px',
'marker_width': '9px',
}
# Integrate the dictionaries above into the dictionary that stores the CSS properties of the legend
legend_dict = {
'id': 'map-legend',
'title': 'Types of Data Collected',
'bottom': '20px',
'right': '20px',
'box_width': '250px',
'box_height': 'auto',
'entries': [marker_1_dict, marker_2_dict, marker_3_dict, marker_4_dict, marker_5_dict]
}The original Python dictionary with the user-defined legend box parameters, now has a new key called entries, which contains a list. Each element in this list contains a dictionary of the CSS properties and values corresponding to one entry in the legend.
Also, the fill and stroke colors in the nested dictarionary are noted in hexadecimals. However, if we look back to our CSS code snippet, it uses an rgba convention. As such, we’ll make a short local function to convert a string from base 16 to a list of three integers corresponding to RGB.
def ColorHex2RGB(hex_str):
"""Function to convert the hexadecimal color to RGB notation
AUTHOR: Mai Tanaka (www.DataDrivenMai.com)
DATE: 2026-06-30
REQUIRES: hex_str = hexadecimal notation of the color (eg. '#06D6A0')
RETURNS: rgb_val = RGB values in a list (eg. [6, 214, 160])
"""
# Remove the hash symbol
hex_str = hex_str.lstrip('#')
# Convert hex pairs to integers
rgb_val = []
for i in (0, 2, 4):
rgb_val.append(int(hex_str[i:i+2], 16))
return rgb_valNow we can make the final GenerateLegendHTML() local function that can make each stylized legend entry with a loop working through the CSS properties stored in the nested Python dictionary.
The only thing we will be doing differently from past GenerateLegendHTML_xx() local functions is that we will need to split up the HTML into three components.
- The starting
legend_htmlcontaining- the opening
<div>tags for the legend box - the complete legend title
- the opening
<div><ul>tags for the legend entries
- the opening
- The middle
marker_htmlinstances containing- the HTML and inline CSS for each legend entry (circle marker)
- The closing HTML containing
- the closing
</ul></div>tags for the legend entries - the closing
</div>for the legend box
- the closing
Each HTML component will be added to the legend_html to generate one complete string as the output. The final function looks like this:
def GenerateLegendHTML(dict_legend):
"""Function to generate the HTML for stylized legend boxes with a legend title and circle markers
AUTHOR: Mai Tanaka (www.DataDrivenMai.com)
DATE: 2026-09-08
REQUIRES: dict_legend = dictionary containing legend id and CSS properties and values including marker visuals in a nested dictionary
PROMISES: legend_html = string containing HTML and inline CSS for generating stylized legend with markers
"""
# Check the position of the legend key
if 'bottom' in dict_legend:
bottom_pos = dict_legend['bottom']
top_pos = 'auto'
elif 'top' in dict_legend:
top_pos = dict_legend['top']
bottom_pos = 'auto'
if 'left' in dict_legend:
left_pos = dict_legend['left']
right_pos = 'auto'
elif 'right' in dict_legend:
right_pos = dict_legend['right']
left_pos = 'auto'
# Add on the new legend HTML legend to the exsiting HTML
legend_html = f"""
<div id='{dict_legend['id']}'
class='map-legend'
style='
position: fixed;
bottom: {bottom_pos};
top: {top_pos};
right: {right_pos};
left: {left_pos};
width: {dict_legend['box_width']};
height: {dict_legend['box_height']}
'>
<div class='legend-title'>{dict_legend['title']}</div>
<div>
<ul class='legend-labels'>
"""
# Enter the HTML up to the start of the unordered list
# Create each legend entry
for entry_now in dict_legend['entries']:
# Convert the stroke and fill colors from hex to rgb
rgb_fill = str(ColorHex2RGB(entry_now['marker_fill']))
rgb_str = str(ColorHex2RGB(entry_now['stroke_color']))
# Take out the parenthesis and add the alpha or opacity
fill_rgba = rgb_fill[1:-1] + ', ' + str(entry_now['fill_opacity'])
stroke_rgba = rgb_str[1:-1] + ', 1.0' # Stroke opacity is always 100 %
# Make the appropriate HTML for the legend entry
marker_html = f"""
<li><span
style='
height: {entry_now['marker_height']};
width: {entry_now['marker_width']};
background: rgba({fill_rgba});
border: 2px solid rgba({stroke_rgba});
'></span>
{entry_now['description']}
</li>
"""
# Add on the marker_html to the legend_html
legend_html += marker_html
# Concatenate the closing HTML tags for the unordered list, the <div> containing the unordered list, and the <div> for the legend box
legend_html += """
</ul>
</div>
</div>
"""
return legend_htmlBy concatenating the internal CSS code snippets and enclosing all the legend HTML inside macros as before, we can show our final custom legend.
# Create legend_html using the legend_dict and concatenate it all
legend_html = GenerateLegendHTML(legend_dict)
legend_html_all = macro_start + legend_css + legend_html + macro_end
# Create the map with the complete pop up text
m = MapSendaiJurisdiction_popup(sendai_df, mid_lat, mid_long, tile_url, attr)
# Create a branca macroelement object and overwrite it with our legend html
legend = branca.element.MacroElement()
legend._template = branca.element.Template(legend_html_all)
# Add the legend to the map
m.get_root().add_child(legend)
# Display the map with the legend
show_folium_safe(m)GenerateLegendHTM(). User-defined inputs stored in a nested Python dictionary are reflected in the legend style and descriptions.
We have created a custom branca legend for our folium map using internal and inline CSS and HTML.
5 Summary
In this step-by-step tutorial, we created a custom folium legend by overwriting the template inherited in branca.element.MacroElement(), and displaying it as the top layer on the map. You learned how to:
- Make stylized legend boxes with user-specified colors, opacities, corner radius, drop shadows and borders
- Take advantage of internal CSS for common properties, while using inline CSS for variable properties
- Create local functions to incorporate user-specified input into inline CSS in the legend HTML
- Include a legend title with properties inherited from a class specified in the internal CSS snippet
- Insert circle markers with appropriate descriptions as legend entries, and modify the marker’s size, marker fill color and opacity, and stroke color
- Make square and rectangle markers instead of circle markers
Hope you find the information in this blog post useful. Happy Mapping!
6 Further Readings
- Learn how to draw up hundreds of scatter plot-like circle markers on
foliummaps - Look up the three unique identifiers for each JMA weather station quickly on my interactive and informative map of all AMeDAS weather stations in Japan